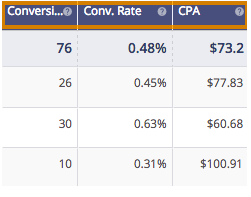
If you have implemented Outbrain’s Pixel on your site or via Google Tag Manager and have received at least one conversion, you’ll be able to see your results upon logging in to your Outbrain account in the Campaigns view.
Conversions come in different shapes and sizes, so make sure that you have properly set up your conversions and named them accordingly by reviewing our comprehensive guide.
Viewing and Modifying Conversion Columns
By default, each conversion you create will populate 5 data columns (in addition to the Totals columns):
- Conversions
- Conversion Rate
- CPA
- Conversions Total Value
- Conversions Average Value

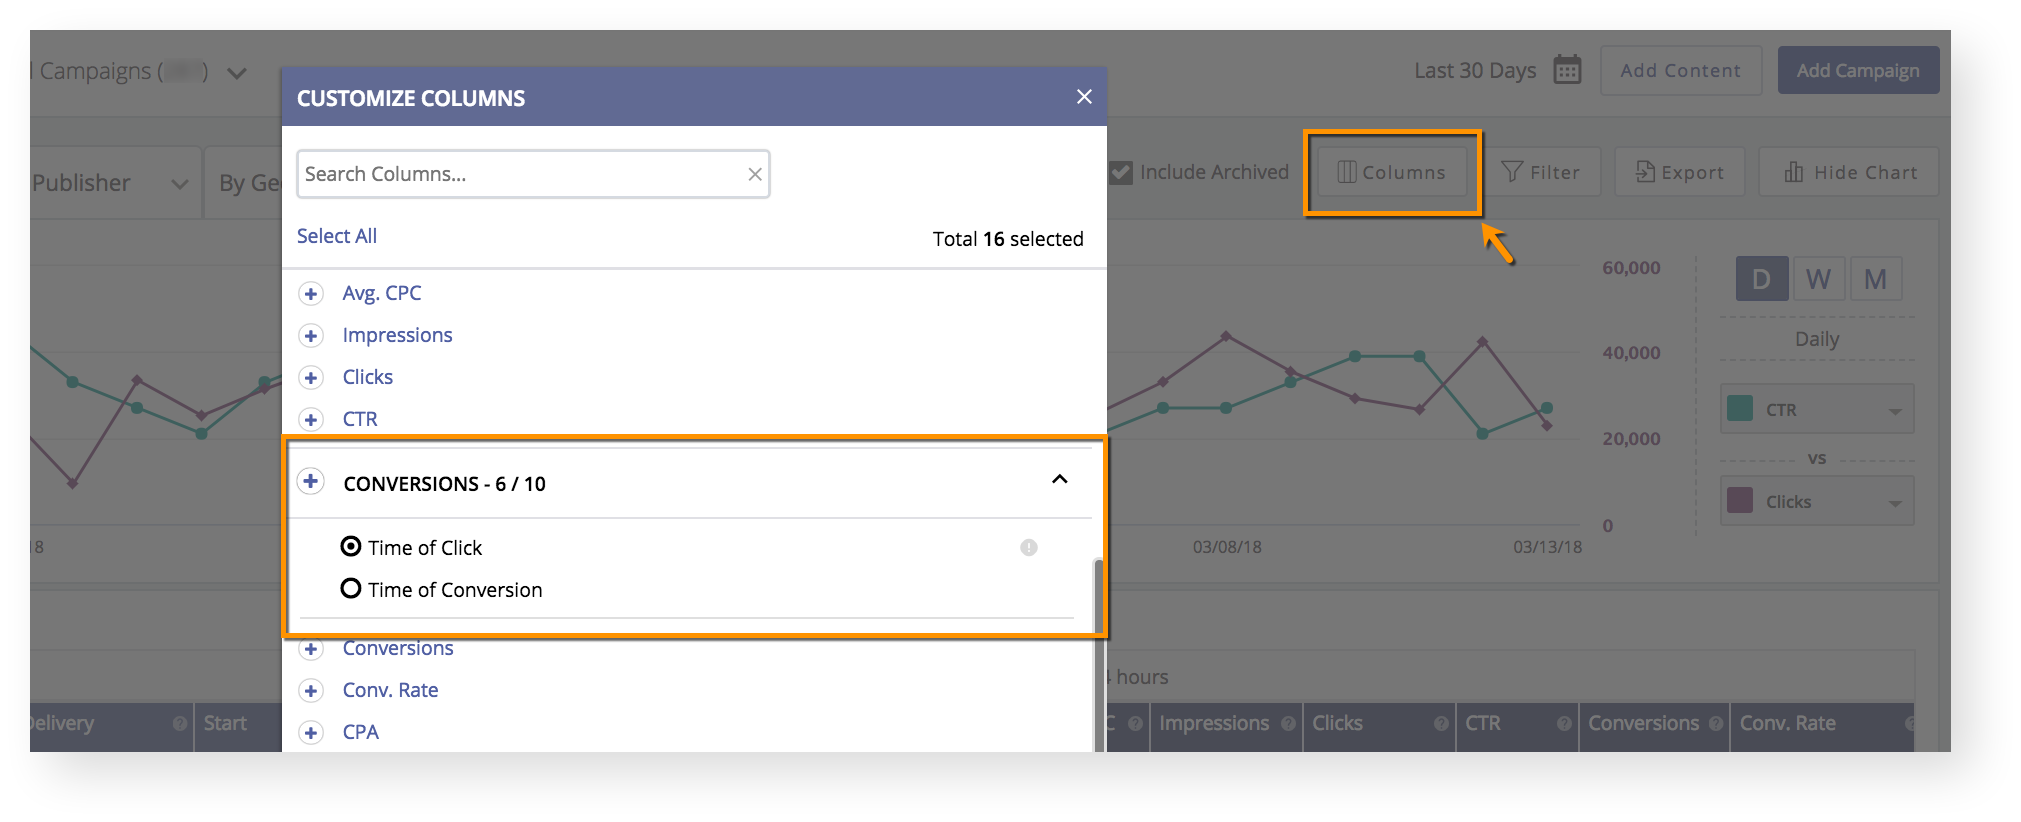
You can organize your view by clicking on the Columns button above the graph. Please keep in mind- this will be your default view on your next login.
Once organized, you can monitor your conversions by different data breakouts using the selections from the top menu.

Creating Filters
Your dashboard is customizable, allowing you to add filters to narrow your data and hone in on the metrics you care about most. Click on the “Filter” button to the left of “Export.” Then, add any relevant values in the Filters toolbar.

To save the data for later analysis, click on the “Export” button.
Conversion Attribution
Conversions will be attributed to the day that the click took place, rather than when the conversion actually occurred. Here’s an example of a reader’s journey on the way to conversion:

In this scenario, the conversion would be attributed to March 1. However, if you would like to change this attribution model to count conversions when the reader actually purchases, you can do so by customizing your conversion columns. Click the “Columns” button in the dashboard, then select “Conversions” to expand the menu. There, you can select the attribution model for your conversions.

If you’re not seeing conversions coming through on your dashboard, check out this Help Center article and/or contact our DIY Customer Success team for more information.